GraphvizでAWS CloudFormationのテンプレートファイルを可視化してみた
こんにちは。データサイエンスチームのtmtkです。
この記事では、AWS CloudFormationのテンプレートファイルをGraphvizを使って可視化してみた話をします。
はじめに
前回の記事では、AWS CloudFormationのテンプレートをAWS CloudFormation Designerを使って可視化しました。しかし、AWS CloudFormation Designerを使った可視化では、サービスとサービスの間の関係がわからないなど、いくつか問題点がありました。
Graphvizはグラフを可視化できるソフトウェアです。ここでいうグラフは「
この記事では、GraphvizとPython 3を組み合わせて、CloudFormationのテンプレートを可視化する方法を紹介します。この記事の方法を使うと、以下のようなグラフを生成できます。この可視化では、前回の記事での可視化とは異なり、リソース間の関係の説明も図に入れることができています。
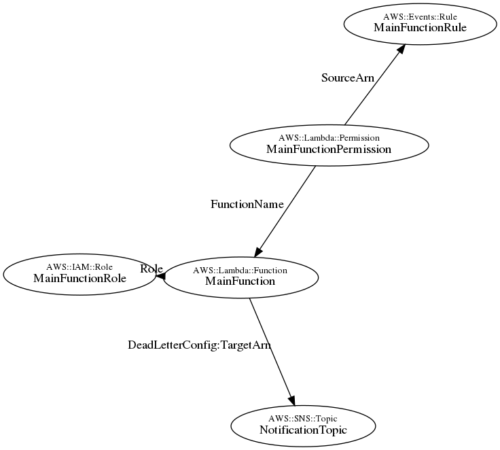
(前回の記事と同じテンプレートを可視化したもの)
方法
それでは可視化を実行する方法を説明します。Python 3で実行します。
まずは下準備です。必要なライブラリを import し、必要な定数などを定義します。ここでは作業ディレクトリ内のYAML形式のテンプレートファイル cloudformation_template.yml を読み込み、中間ファイル diagram.dot を生成することにします。
from collections import namedtuple
from awscli.customizations.cloudformation.yamlhelper import yaml_parse

Node = namedtuple("Node", ["name", "type"])
Edge = namedtuple("Edge", ["source", "target", "history"])
TEMPLATE_FILENAME = "cloudformation_template.yml"
DOT_FILENAME = "diagram.dot"
次に、テンプレートファイルを読み込む関数を準備します。CloudFormationのYAML形式のテンプレートファイルはPyYAMLでは読み込めないようなので、AWS CLIの読み込み機能を使います。
def read_template_yaml(filename):
    """Read a template YAML from filename"""
    with open(filename) as yaml:
        parsed_yaml = yaml_parse(yaml.read())
    return parsed_yaml
読み込んだテンプレートファイルからグラフを構築する機能を作ります。グラフは頂点と辺からなるので、頂点と辺を構築します。辺を構築するにあたっては、深さ優先探索によってテンプレート内を探索し、 Properties 内に他のリソースへの参照があった場合はグラフに辺を追加します。
def construct_graph(template):
    """Construct a graph from template"""
    nodes = []
    edges = []
    resources = template["Resources"]
    for name, attributes in resources.items():
        nodes.append(Node(name, attributes["Type"]))
        if "Properties" in attributes:
            dfs(name, [], attributes["Properties"], edges)
    return nodes, edges

def dfs(source, history, tree, edges):
    """Add edges by walking by DFS"""
    if not isinstance(tree, dict):
        return
    for key, value in tree.items():
        if key == "Ref":
            edges.append(Edge(source, value, history))
        if key == "Fn::GetAtt":
            edges.append(Edge(source, value[0], history))
        dfs(source, history + [key], value, edges)
中間ファイルを出力する機能を作ります。中間ファイルはDOT言語という形式で、Graphvizで出力するグラフを指定するのに使えるものです。
def write_dot(nodes, edges):
    """Write out a .dot file"""
    nodes_expression = [
        '"{name}"[label=<<font point-size="10">{label}</font><br />{name}>];'.format(
            name=node.name,
            label=node.type
        ) for node in nodes
    ]
    edges_expression = [
        '"{source}" -> "{target}"[label="{label}"];'.format(
            source=edge.source,
            target=edge.target,
            label=":".join(edge.history)
        ) for edge in edges
    ]
    with open(DOT_FILENAME, "w") as out_file:
        out_file.writelines("".join(
            ["digraph g{",
             "graph[layout = neato];"] +
            nodes_expression +
            edges_expression +
            ["}"]
        ))
最後に、用意した関数を順に呼び出すことで、入力ファイル cloudformation_template.yml から中間ファイル diagram.dot が生成されます。
def main():
    """Open a template yaml file and make a dot file"""
    template = read_template_yaml(TEMPLATE_FILENAME)
    nodes, edges = construct_graph(template)
    write_dot(nodes, edges)

if __name__ == "__main__":
    main()
生成された中間ファイルからGraphvizを使ってグラフを出力できます。シェルからGraphvizを呼び出します。
dot -Tpng -o output.png diagram.dot -Goverlap=false -Gsplines=true
すると、 output.png に図が出力されます。
実行例
最初のものを再掲しますが、これは前回と同じテンプレートを今回の方法で可視化したものです。
大きなテンプレートファイルも可視化することができます。(読めないようにぼかしています)
また、仮にリソースタイプとアイコンの対応をうまく取得することができれば、以下のようにアイコンつきの可視化を作ることができるかもしれません。
![]()
まとめ
この記事では、Graphvizを使ってCloudFormationのテンプレートファイルを可視化しました。

データ分析と機械学習とソフトウェア開発をしています。 アルゴリズムとデータ構造が好きです。


Recommends
こちらもおすすめ
-

基礎からはじめる時系列解析入門
2019.2.22
-

畳み込みニューラルネットワークの畳み込み層の重みを可視化する方法
2018.7.10
-

VAEを用いたUNIXセッションのなりすまし検出
2018.12.17


Special Topics
注目記事はこちら

データ分析入門
これから始めるBigQuery基礎知識
2024.02.28

AWSの料金が 10 %割引になる!
『AWSの請求代行リセールサービス』
2024.07.16